WiFiPerf Professional is a bandwidth performance measurement app for Mac OS that operates as a testing client when connected to different testing servers. The app is used to test Mac OS, iOS, Windows, and Android that run either iPerf2/iPerf3 (server mode) or WiFiPerf EndPoint.
It was built for testing bandwidth to other devices, such as desktops, laptops, and mobile devices. This ensures real world network testing of actual devices within a network. WiFiPerf Professional also allows users to queue multiple tests using varying test settings.
Built upon the open source iPerf3 software (available for many operating systems), WiFiPerf Professional is able to measure the available TCP and UDP bandwidth between two hosts. This includes both wired and wireless devices on the network.
Overview
The following was created to provide statistical analysis showing the differences between multiple Cisco Wireless Access Points using the WiFiPerf Professional software. These numbers can help determine the proper devices that an organization will need for their future WLAN deployments.
The network topology below was designed for testing four different access points and determining the different bandwidth that each one is capable of providing.
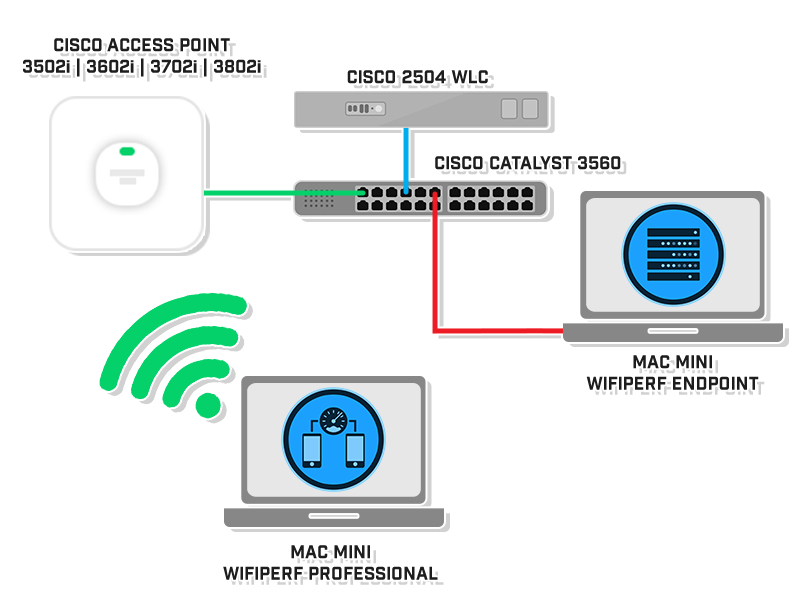
The network topology is a Controller-Based WLAN that consists of a Cisco Wireless Access Point, Cisco 2504 WLC, Catalyst 3560, and two Mac Minis with one running the WiFiPerf Professional and the other running WiFiPerf EndPoint.
Running Test
Once the network topology has been created and the configurations have been set, we are now capable of running the WiFiPerf Professional software.
Connect the WiFiPerf Professional to the SSID of the access point. The device should receive an IP address within the same subnet and VLAN of the WiFiPerf EndPoint that is directly connected to the switch.
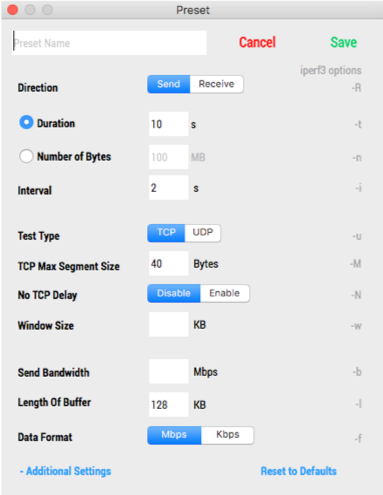
Create a Preset to determine what kind of data traffic (TCP/UDP, Rate, Speed, etc.) the software will be sending to the server.
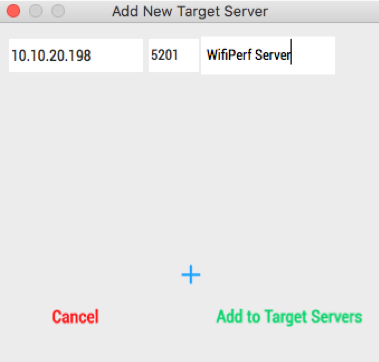
Next, add a Target Server. The IP address can be found on your WiFiPerf EndPoint.
To create a test, select a Preset and a Target Server that you want to use, and it will be added to the Queue.
Select Start to run the test.

The test results will be available once the test is complete. To review the results later, you can select the Results tab at the top of the page.

Performance Results
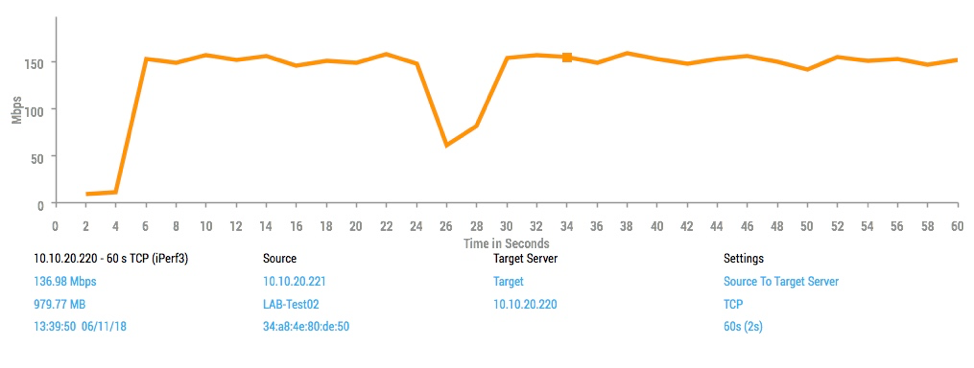
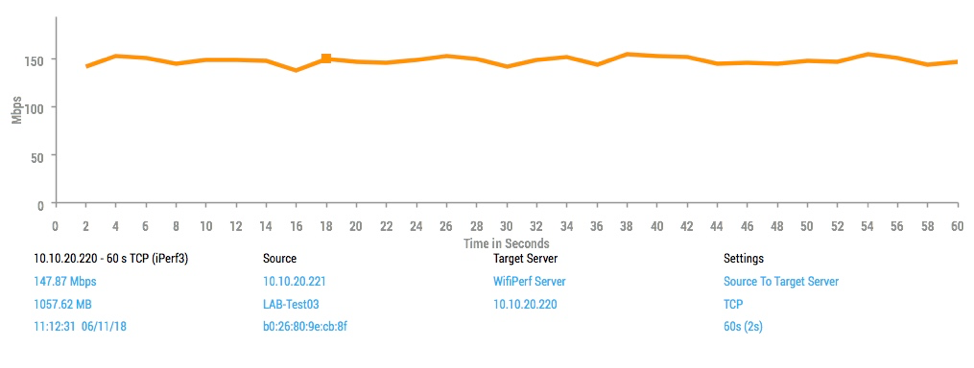
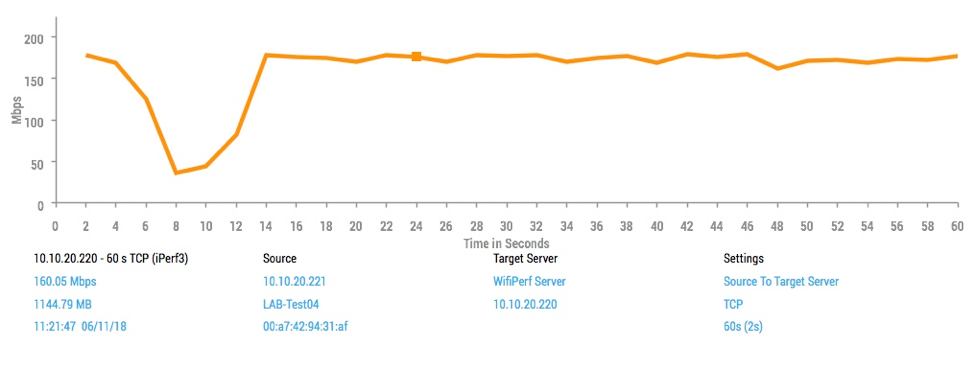
The following graphs and statistics were generated using the WiFiPerf Professional. When analyzing the line graphs, you will notice that there are drops in speeds which are normal for most wireless transmissions. The average speed for the entire 60s interval is calculated for the final bandwidth.
Mac Mini 802.11n 2x2
3502i 60s Performance Test
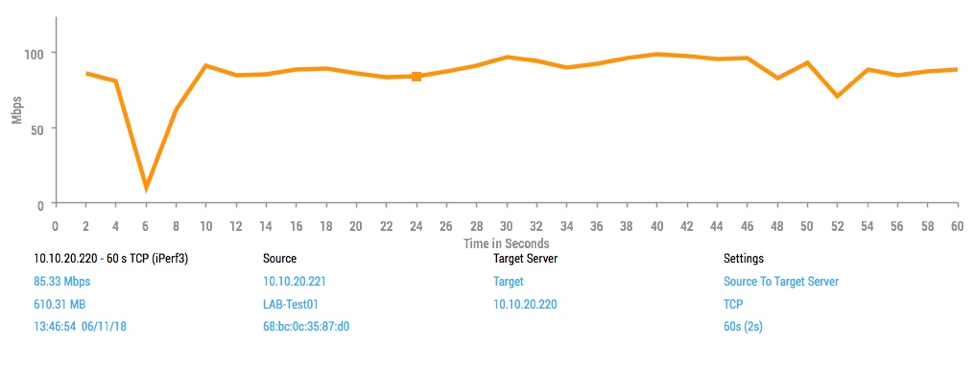
3602i 60s Performance Test
3702i 60s Performance Test
3802i 60s Performance Test
The spreadsheet below shows the results when testing speeds of the 802.11n device.
|
WiFiPerf Testing Results Mac Mini 802.11n 2x2 |
||||
|
Access Point |
Description |
Bandwidth |
Total MB |
Test Duration |
|
3502i |
802.11a/g/n 4x4:3 |
85.33 Mbps |
610.31 MB |
60s |
|
3602i |
802.11n 4x4:3 |
136.98 Mbps |
979.77 MB |
60s |
|
3702i |
802.11ac 4x4:3 |
147.87Mbps |
1057.62 MB |
60s |
|
3802i |
802.11ac 4x4:3 |
160.05 Mbps |
1144.79 MB |
60s |
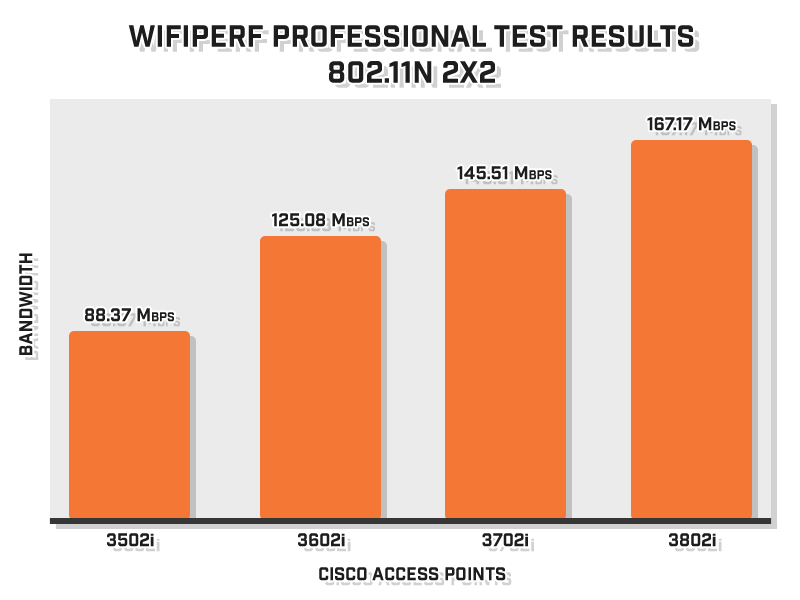
Even though all access points and clients were utilizing 802.11n, the newer access points are capable of processing much higher data rates.
For a better visualization, the chart below depicts the spreadsheet above.
Dell Latitude E7470 802.11ac 2x2
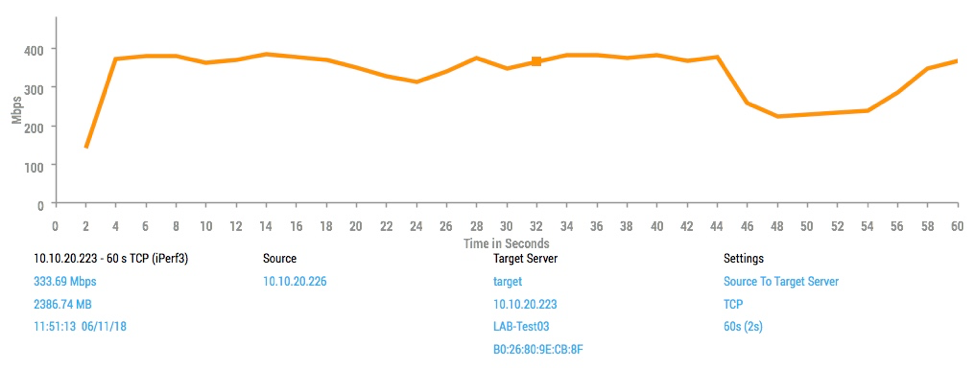
3702i 60s Performance Test
3802i 60s Performance Test
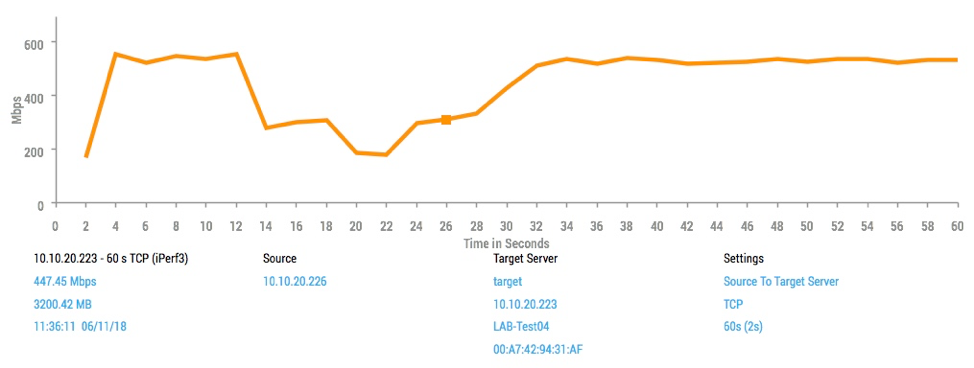
The spreadsheet below shows the results when testing speeds of an 802.11ac device.
|
WiFiPerf Testing Results Mac Mini 802.11ac 2x2 |
||||
|
Access Point |
Description |
Bandwidth |
Total MB |
Test Duration |
|
3702i |
802.11ac 4x4:3 |
333.69 Mbps |
2386.74 MB |
60s |
|
3802i |
802.11ac 4x4:3 |
447.45 Mbps |
3200.42 MB |
60s |
Even though both access points and clients were utilizing 802.11ac, the newer access points are capable of processing much higher data rates.
For a better visualization, the chart below depicts the spreadsheet.
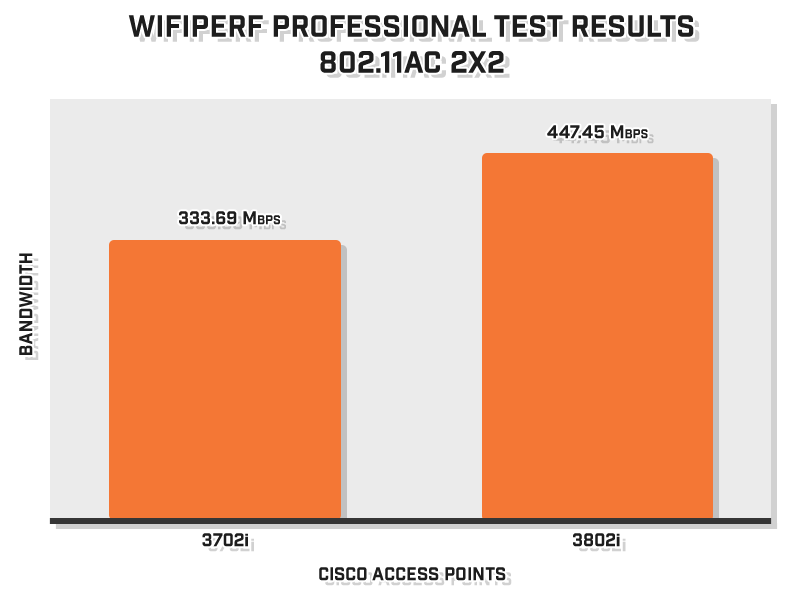
With each new access point, you can expect improvements such as these. Some organizations require the latest and greatest but others are capable of settling for less. Tests like these will help with the decision making process.
Budgeting for WLAN
Based on these results, it is safe to assume that simply upgrading your WLAN equipment can greatly improve the performance of your network. However, the question that needs to be asked is whether these improvements are worth the cost.
|
Access Point Pricing per Device |
|||
|
3502i |
3602i |
3702i |
3802i |
|
$1,295.00 |
$1,645.00 |
$1,645.00 |
$1,695.00 |
*The general price breakdown above was created using prices from itprice.com.
With budget being one of the largest restrictions to an organization’s WLAN, finding a happy medium between meeting budgetary requirements and network requirements can be difficult. It is best to work out the requirements of the network and plan accordingly.
When considering the price and performance of each access point, we can simplify each device based on what the client will be receiving.
3502i
The cheapest access point, retailing at $1,295.00 per unit. It allows for a cheap deployment for organizations that do not have the budget for the newest equipment. This option, however, will not be as suitable for networks that require faster data rates, a larger capacity of clients.
3602i
The second cheapest access point, retailing at $1,645.00. The price of this deployment is high and will not allow for any advantages compared to the newer access points.
3702i
This access point retails at $1,645.00 and allows for a slightly cheaper deployment in comparison to the 3802i. It allows for 802.11ac and more advanced bandwidth.
3802i
The most expensive access point, retailing at $1,695.00. These devices require the highest budget and give the client the fastest data rates and overall most usable experience.


