Your laptop shows full WiFi bars, but video calls are still choppy. Your phone shows -85 dBm, but someone says that's fine. What does any of it actually mean? WiFi signal strength measurement is more nuanced than most IT professionals realize — and misunderstanding it leads to poor deployment decisions. Here's what the numbers actually tell you.
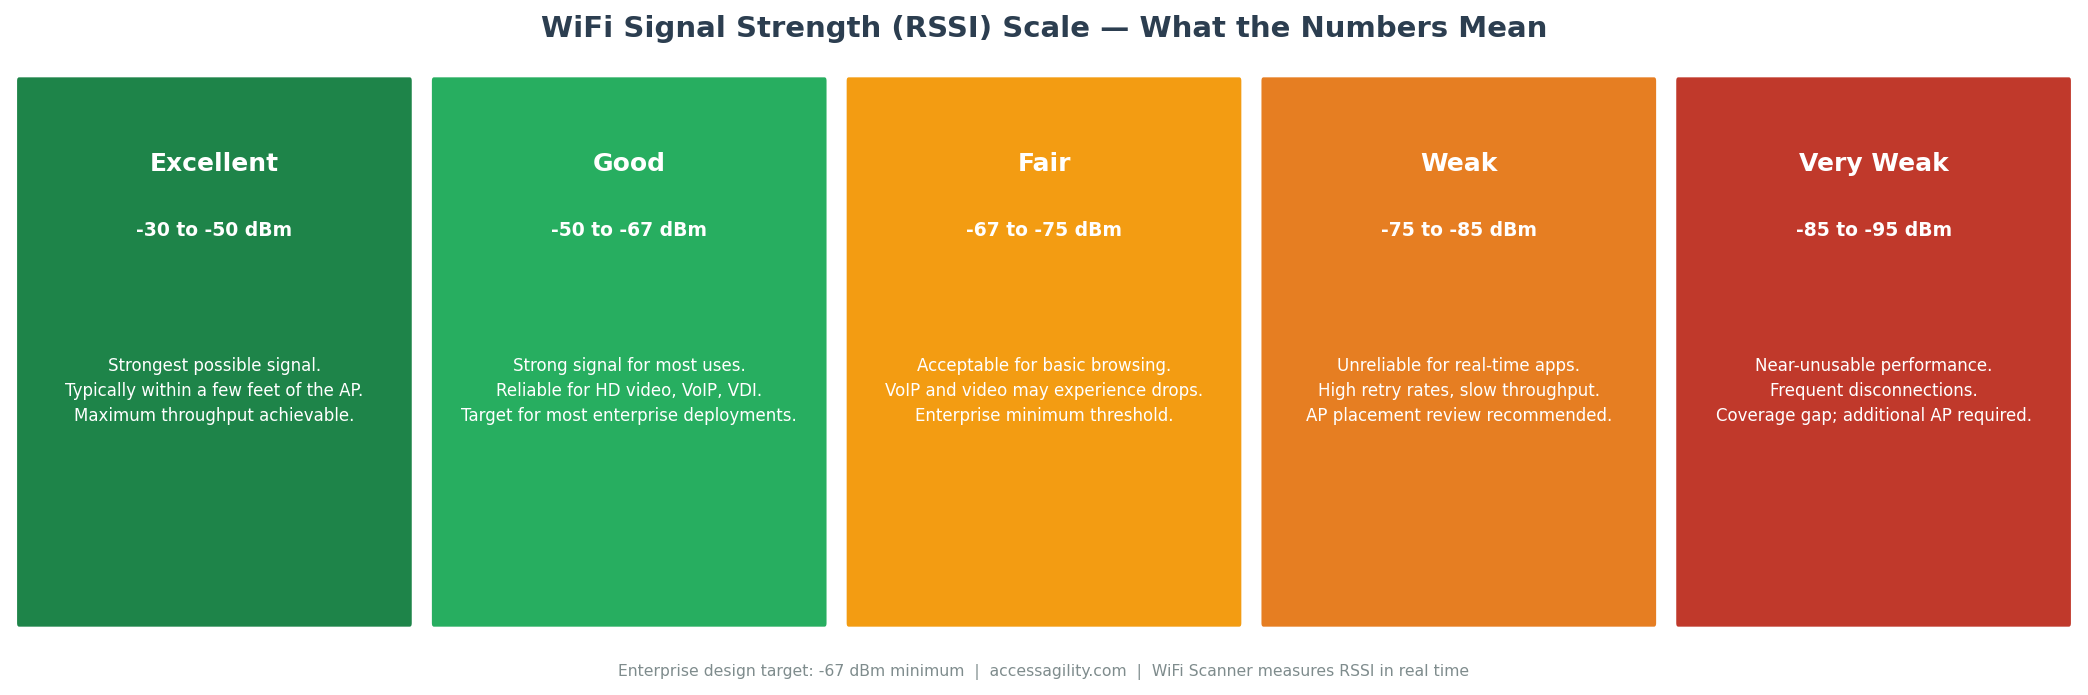
RSSI is measured in negative dBm values. The closer to zero, the stronger the signal. Most enterprise designs target -67 dBm as the minimum threshold.
What Is RSSI?
RSSI stands for Received Signal Strength Indicator. It's a measurement of the power level of a received WiFi signal, expressed in dBm (decibels relative to one milliwatt). RSSI values are always negative — a value closer to zero means a stronger signal. The range typically spans from -30 dBm (excellent, very close to the AP) to -90 dBm (extremely weak, near the edge of usability).
Understanding the dBm Scale
The dBm scale is logarithmic, not linear. The difference between -50 dBm and -53 dBm sounds small numerically but represents half the signal power. This matters because a 3 dB change that looks minor on a dashboard can represent a meaningful real-world performance difference, especially at the margins of coverage.
-30 to -50 dBm: Excellent. You're close to the AP. Maximum throughput is achievable. This range is typical within the same room as the AP.
-50 to -67 dBm: Good. Strong enough for all enterprise applications including HD video, VoIP, and VDI. This is the target range for your designed coverage area.
-67 to -75 dBm: Fair. Acceptable for basic web and email. Voice and video applications may experience intermittent issues. Most enterprise designers use -67 dBm as the minimum acceptable threshold.
-75 to -85 dBm: Weak. Throughput drops significantly. Roaming clients may exhibit sticky behavior as their adapter tries to maintain this weak connection rather than roaming to a stronger AP.
Below -85 dBm: Very weak to unusable. Frequent disconnections, high retry rates, and effectively zero useful throughput for most applications.
Why Signal Strength Alone Isn't Enough
RSSI tells you how loud the signal is — it doesn't tell you how clear it is. A -60 dBm signal in an RF environment with a -65 dBm noise floor has an SNR (signal-to-noise ratio) of only 5 dB, which is completely unusable. The same -60 dBm signal with a -95 dBm noise floor has an SNR of 35 dB, which is excellent.
This is why professional WiFi surveys measure both RSSI and SNR — and why tools like WiFi Scanner report both values for every AP and every survey location.
What "Bars" on Your Device Actually Mean
The signal bars shown by operating systems (Windows, iOS, Android) are not RSSI readings — they are visual abstractions that are inconsistent between manufacturers and often misleading. Five bars on an iPhone in a conference room can correspond to anything from -50 dBm to -75 dBm depending on the iOS version and the AP vendor. For accurate signal measurement, use a dedicated WiFi scanning tool rather than trusting OS signal indicators.
How to Use RSSI for WiFi Planning
Use RSSI data from a passive site survey to identify coverage gaps (areas below -67 dBm), set AP minimum RSSI thresholds for band steering and roaming decisions, and validate that post-deployment coverage meets your design targets. AccessAgility's professional survey services produce RSSI and SNR heatmaps that give you the complete picture of your network's RF health.
Ready to optimize your enterprise WiFi?
AccessAgility provides professional WiFi design, site surveys, and continuous monitoring tools trusted by enterprises and government agencies nationwide.
Get a Free WiFi Assessment ›