

"Scan" Tab
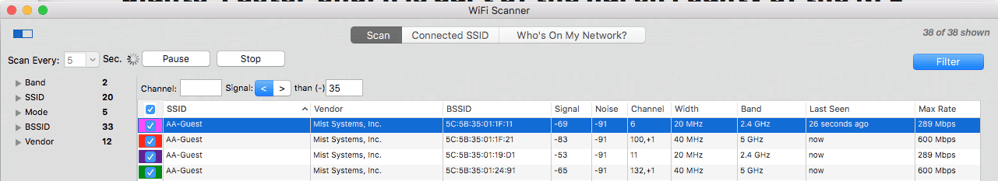
The Scan tab allows the user to scan for networks using the computer’s built-in capabilities. Users can filter results, gain more information about each network, view network congestion, as well as test speeds on the network the user is connected.

Controls and Filters
The default setting is 5 seconds for every scan, which means that WiFi Scanner will run tests every 5 seconds until the user pauses or stops the scan. This ensures that the user has refreshed data as quickly as possible.
The filters are very helpful when the user is trying to narrow down the results in a high-volume area. These features can be utilized before, during, or after the current scan has been performed.
The left side filter is accessed by the tab icon in the upper left-hand corner. Users can select an option and it will be filter on the right-hand table. Use SHIFT and COMMAND keys to select multiple values. It is categorized by:
- Band (2.4 GHz or 5 GHz)
- SSID
- Mode (802.11b/g/n/ac)
- BSSID
- Vendor (this can be updated via Help menu and choosing Update Vendor OUI and)
The FILTER button on the right-hand side opens up a secondary filter. Simply enter the Channel (add multiple by separating by commas) / Signal fields and hit enter on the keyboard to activate those filters.
Information Chart
The information gathered is separated into columns. These columns can all be rearranged except for the Check Boxes, and SSID. The network that the user is connected to will be highlighted in this section with a yellow hue. Columns can be toggled on/off from the preferences menu.

General Column Definitions
| Ad-Hoc | Whether the network is setup as and Ad-Hoc or not |
| BSSID / MAC Address | The MAC address or unique address that identifies each specific device |
| CC | The Country Code of a network (if given by the Access Point) |
| Channel | The specific channel a network is operating on |
| Channel Band | The frequency range that a network is operating on |
| Channel Width | The size of the channel |
| Check Boxes | When networks are checked, they will display in the various graphs |
| Join |
Allows the user to connect to a specific network* *Note: Specific APs may force the users device to the best RSSI, so users will Join an AP, only to be immediately moved to the ones the APs choose. |
| Last Seen | A time stamp for when the last time a device was detected |
| Max Rate | The maximum speed an Access Point can send and receive data |
| Noise | The amount of interference that is in a signal |
| PHY Mode | The type of protocol a network’s Access Point is using |
| S/N | Signal to Noise Ratio (The higher the positive number, the better) |
| Security | The type of security that a device currently has implemented |
| Signal | The signal strength or RSSI received from a device |
| SSID | The name of a network. If the user has multiple Access Points on one network, then there could be multiple SSIDs with the same name (but will have varying BSSIDs) |
| Streams | The number of spatial streams an Access Point is capable of transmitting and receiving |
| Tag | Double Click this column to add a “tag” of your choice to the selection and further organize the chart |
| Vendor OUI | The manufacturer of the Access Point |
| WPS | Whether WiFi Protected Setup is enabled or not |
Advanced Column Definitions
Note: Not all advanced information can be collected from every Access Point.
| 802.11r | Currently supported by iOS & OSX, this 802.11 standard is an essential part of the WiFi Alliance "Voice Enterprise" certification and permits Fast Secure Roaming in less than 20 milliseconds |
| # Client | Quickly determine the amount of clients connected to an AP (If QBSS Load enabled in the infrastructure). Great for analyzing client distribution in a high-density environment with multiple AP's |
| AP Name | Identify signal strength to AP's by name. No need to correlate which BSSID MAC address belongs to which AP |
| Channel Utilization | A snapshot of the AP's perspective on Channel Utilization. Great for spotting a potential problem, you may want to investigate |
| Protection Mechanisms | Quickly determine whether you have legacy devices in or around your 802.11n network that are slowing network down to do protection mechanisms getting enabled |
Speed Test Column Definitions
| Avg Down Speed | Average download speed of all tests run on an Access Point |
| Avg Up Speed | Average upload speed of all tests run on an Access Point |
| Max Down Speed | Maximum download speed of all tests run on an Access Point |
| Max Up Speed | Maximum upload speed of all tests run on an Access Point |
| Min Down Speed | Minimum download speed of all tests run on an Access Point |
| Min Up Speed | Minimum upload speed of all tests run on an Access Point |
| Recent Down Speed | Most recent download speed run on an Access Point |
| Recent Up Speed | Most recent upload speed run on an Access Point |
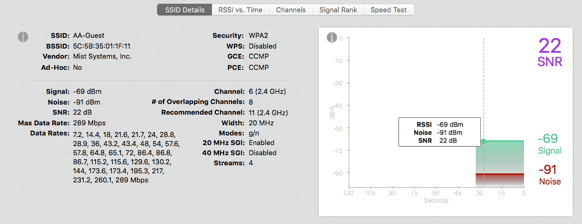
Selected Network Information: SSID Details
Clicking on a row in the information chart highlights the row in blue and displays that network’s information in the SSID Details section. This is where most of the information gathered about a network is displayed.
New Features
# of Overlapping Channels - Shows the complete number of channels that may be interfering with the selected network.
Recommended Channel - Suggests the best channel for the selected network with the least amount of possible interference, based on overlap and usage.
Troubleshooting Graphs
RSSI vs. Time
The networks that are checked in the Information Chart will be graphed in these graphs. The RSSI vs. Time graph, which displays the signal strength or RSSI (received signal strength indicator) over time. Selecting a specific network that is checked will highlight that network in the graphs, as well as dim the others.

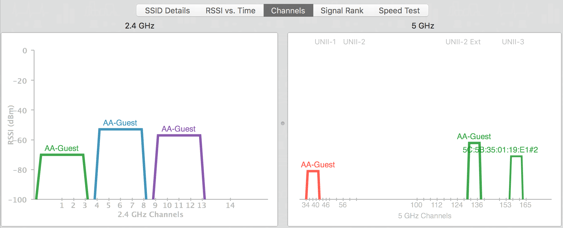
Channels
The Channels graph displays all the networks that are checked in the Information Chart. The recommended channels for 2.4 GHz Band are 1, 6, and 11 because they allow for the best spread of frequency without overlap (interference) with other networks. Choosing the most vacant of the recommended channels for the user’s network will ensure the best chance for the strongest signal with the least amount of noise.
Signal Rank
Signal Rank is a feature that plots all of the checked networks signal strength, for a quick and easy comparison. This graph will also highlight other Access Points on the same network, which allows users to see which Access Point might give them the best and/or fastest connection.
Blue indicates which Access Point is selected in the Information Chart.
Yellow indicates the Access Point a user is currently connected to.
Users can select a bar to view which network it belongs too, which is indicated by the grey color.
![]()
Speed Test
From this tab, the user can test download and upload speed, as well as the connection delay. Users can choose from various servers to test to around the world. The results are graphed and recorded within the app, which can be accessed by clicking the i button to the left. Clicking the purple bar graph icon changes the plot graph to a bar graph that ranks the test results based on download or upload speed.

Speed Test: Change Servers
By default, WiFi Scanner will try to connect to the fastest server available to the user. Users manually select a server by clicking on the server name (see image below.) This will provide a pop up window with a list of closest servers to test to.
